FabCon is coming to Atlanta
Join us at FabCon Atlanta from March 16 - 20, 2026, for the ultimate Fabric, Power BI, AI and SQL community-led event. Save $200 with code FABCOMM.
Register now!- Power BI forums
- Get Help with Power BI
- Desktop
- Service
- Report Server
- Power Query
- Mobile Apps
- Developer
- DAX Commands and Tips
- Custom Visuals Development Discussion
- Health and Life Sciences
- Power BI Spanish forums
- Translated Spanish Desktop
- Training and Consulting
- Instructor Led Training
- Dashboard in a Day for Women, by Women
- Galleries
- Data Stories Gallery
- Themes Gallery
- Contests Gallery
- Quick Measures Gallery
- Notebook Gallery
- Translytical Task Flow Gallery
- TMDL Gallery
- R Script Showcase
- Webinars and Video Gallery
- Ideas
- Custom Visuals Ideas (read-only)
- Issues
- Issues
- Events
- Upcoming Events
Calling all Data Engineers! Fabric Data Engineer (Exam DP-700) live sessions are back! Starting October 16th. Sign up.
- Power BI forums
- Get Help with Power BI
- Custom Visuals Development Discussion
- Re: D3 V4 gallery library implementation with depe...
- Subscribe to RSS Feed
- Mark Topic as New
- Mark Topic as Read
- Float this Topic for Current User
- Bookmark
- Subscribe
- Printer Friendly Page
- Mark as New
- Bookmark
- Subscribe
- Mute
- Subscribe to RSS Feed
- Permalink
- Email to a Friend
- Report Inappropriate Content
D3 V4 gallery library implementation with dependencies
Hello everyone,
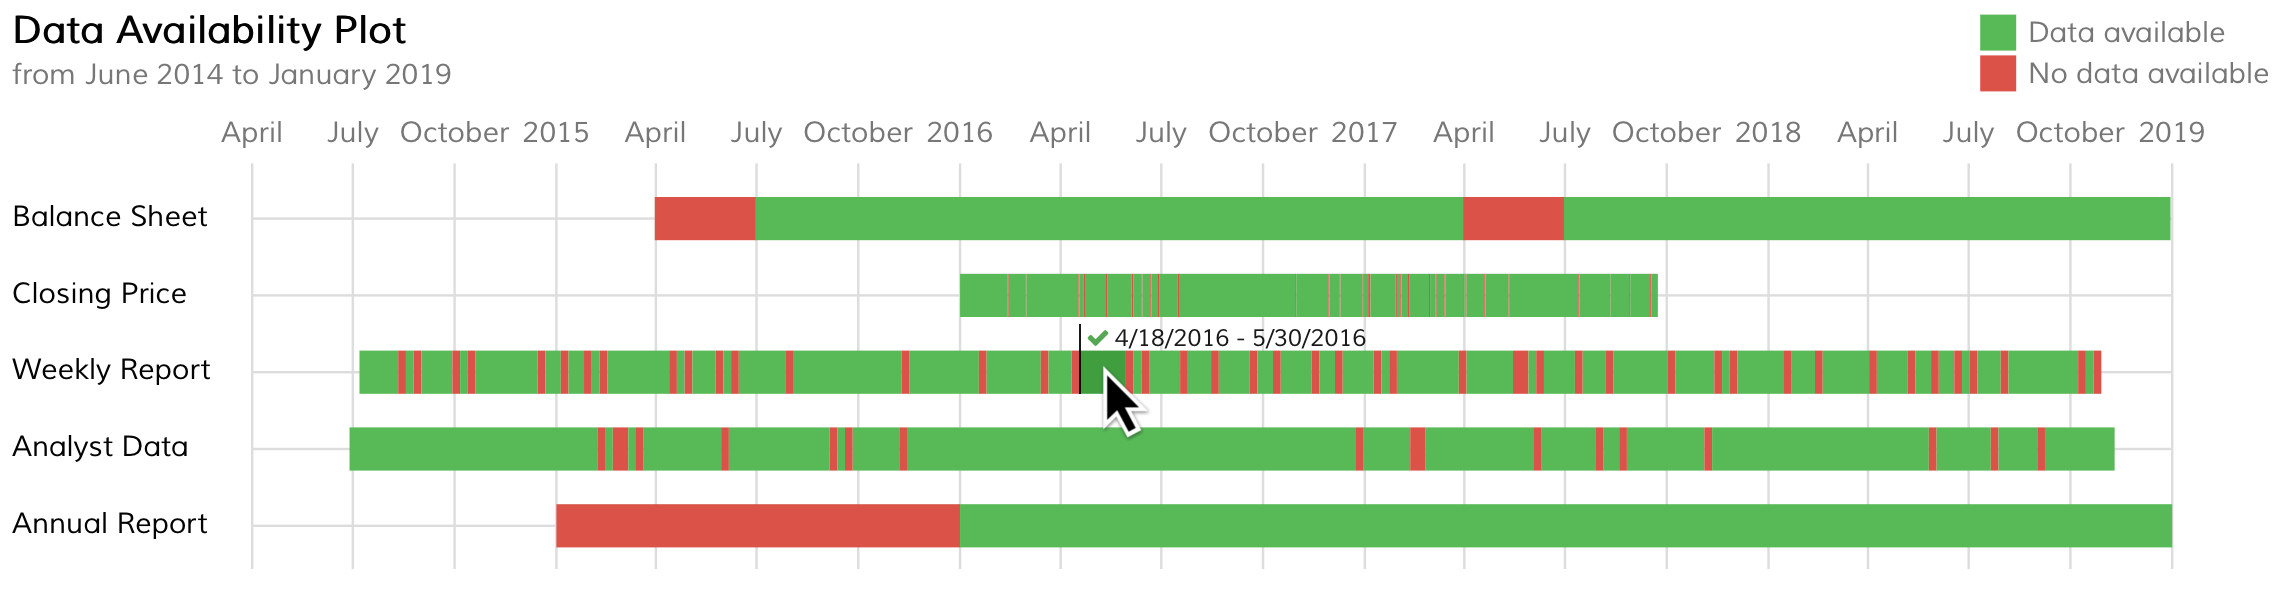
I'm trying to implement an example library from the D3 gallery called Visavail. A demo of this library can be found here: link.
I'm having difficulties getting it to work, any help or pointers will be appriciated.
Setup:
- Installed Moment with npm
- Installed D3 V4 with npm
- Added Visavail library to the node_modules folder
- Added font-awesome tot the style folder
Then I referenced it all in pbiviz.json:
  "externalJS": [
    "node_modules/powerbi-visuals-utils-dataviewutils/lib/index.js",
	  "node_modules/d3/build/d3.min.js",
    "node_modules/visavail/js/visavail.js",
    "node_modules/moment/min/moment-with-locales.min.js"
  ],
  "style": "style/visual.less",
  "capabilities": "capabilities.json",
  "dependencies": "dependencies.json",
  "stringResources": []
The CSS was referenced in the visual.less file:
@import (less) "style/font-awesome/css/font-awesome.min.css";
@import (less) "node_modules/visavail/css/visavail.css";
The code:
In Visual.ts, based on the hello world update counter I recreated the Visavail example with static data.
module powerbi.extensibility.visual {
    "use strict";
    export class Visual implements IVisual {
        private target: HTMLElement;
        private settings: VisualSettings;

        private d3;
        private visavail;
        private moment;
        private svg;
        private mydataset;
        private chart;

        constructor(options: VisualConstructorOptions) {
            console.log('Visual constructor', options);
            this.target = options.element;

            this.d3 = (window as any).d3;
            this.visavail = (window as any).visavail;
            this.moment = (window as any).moment;

            this.moment.locale("en");

            this.svg = this.d3.select(this.target).append('svg');

        }

        public update(options: VisualUpdateOptions) {
            this.settings = Visual.parseSettings(options && options.dataViews && options.dataViews[0]);
            this.target.innerHTML = '<p id="example">TEST</em></p>';

            this.chart = this.visavail.visavailChart().width(800);

            this.mydataset = [{
                "measure": "Annual Report",
                "data": [
                    ["2015-01-01", 0, "2015-03-04"],
                    ["2016-01-01", 1, "2016-03-03"],
                    ["2017-01-01", 1, "2017-03-06"],
                    ["2018-01-01", 1, "2018-04-01"]
                ]
            }];

            this.d3.select("#example").datum(this.mydataset).call(this.chart);
        }

        private static parseSettings(dataView: DataView): VisualSettings {
            return VisualSettings.parse(dataView) as VisualSettings;
        }

        public enumerateObjectInstances(options: EnumerateVisualObjectInstancesOptions): VisualObjectInstance[] | VisualObjectInstanceEnumerationObject {
            return VisualSettings.enumerateObjectInstances(this.settings || VisualSettings.getDefault(), options);
        }
    }
}
- Am I referencing the dependencies correctly?
- Am I importing the dependencies correctly?
- Am I implementing the dependencies correctly?
- How do I debug this?
I zipped the entire project, it can be downloaded here:
https://www.dropbox.com/s/aggbcdm4vnooy8h/statisTimeLine2.zip?dl=0
Solved! Go to Solution.
- Mark as New
- Bookmark
- Subscribe
- Mute
- Subscribe to RSS Feed
- Permalink
- Email to a Friend
- Report Inappropriate Content
- Mark as New
- Bookmark
- Subscribe
- Mute
- Subscribe to RSS Feed
- Permalink
- Email to a Friend
- Report Inappropriate Content
Hello everyone,
I'm trying to implement an example library from the D3 gallery called Visavail. A demo of this library can be found here: link.
I'm having difficulties getting it to work, any help or pointers will be appriciated. I don't know where to post it, if this is the wrong place please delete this post.
Setup:
- Installed Moment with npm
- Installed D3 V4 with npm
- Added Visavail library to the node_modules folder
- Added font-awesome tot the style folder
Then I referenced it all in pbiviz.json:
  "externalJS": [
    "node_modules/powerbi-visuals-utils-dataviewutils/lib/index.js",
	  "node_modules/d3/build/d3.min.js",
    "node_modules/visavail/js/visavail.js",
    "node_modules/moment/min/moment-with-locales.min.js"
  ],
  "style": "style/visual.less",
  "capabilities": "capabilities.json",
  "dependencies": "dependencies.json",
  "stringResources": []
The CSS was referenced in the visual.less file:
@import (less) "style/font-awesome/css/font-awesome.min.css";
@import (less) "node_modules/visavail/css/visavail.css";
The code:
In Visual.ts, based on the hello world update counter I recreated the Visavail example with static data.
module powerbi.extensibility.visual {
    "use strict";
    export class Visual implements IVisual {
        private target: HTMLElement;
        private settings: VisualSettings;

        private d3;
        private visavail;
        private moment;
        private svg;
        private mydataset;
        private chart;

        constructor(options: VisualConstructorOptions) {
            console.log('Visual constructor', options);
            this.target = options.element;

            this.d3 = (window as any).d3;
            this.visavail = (window as any).visavail;
            this.moment = (window as any).moment;

            this.moment.locale("en");

            this.svg = this.d3.select(this.target).append('svg');

        }

        public update(options: VisualUpdateOptions) {
            this.settings = Visual.parseSettings(options && options.dataViews && options.dataViews[0]);
            this.target.innerHTML = '<p id="example">TEST</em></p>';

            this.chart = this.visavail.visavailChart().width(800);

            this.mydataset = [{
                "measure": "Annual Report",
                "data": [
                    ["2015-01-01", 0, "2015-03-04"],
                    ["2016-01-01", 1, "2016-03-03"],
                    ["2017-01-01", 1, "2017-03-06"],
                    ["2018-01-01", 1, "2018-04-01"]
                ]
            }];

            this.d3.select("#example").datum(this.mydataset).call(this.chart);
        }

        private static parseSettings(dataView: DataView): VisualSettings {
            return VisualSettings.parse(dataView) as VisualSettings;
        }

        public enumerateObjectInstances(options: EnumerateVisualObjectInstancesOptions): VisualObjectInstance[] | VisualObjectInstanceEnumerationObject {
            return VisualSettings.enumerateObjectInstances(this.settings || VisualSettings.getDefault(), options);
        }
    }
}
- Am I referencing the dependencies correctly?
- Am I importing the dependencies correctly?
- Am I implementing the dependencies correctly?
- How do I debug this?
I zipped the entire project, it can be downloaded here:
https://www.dropbox.com/s/aggbcdm4vnooy8h/statisTimeLine2.zip?dl=0
- Mark as New
- Bookmark
- Subscribe
- Mute
- Subscribe to RSS Feed
- Permalink
- Email to a Friend
- Report Inappropriate Content
